#
Showing posts with label Wireshark. Show all posts

Wednesday, July 28, 2021

Packet analysis is a crucial skill for application level troubleshooting. Primary tool is Wireshark and following are some commands which will often come in handy to filter the interested traffic.


Filtering Conditions

These are the filtering criteria to be matched and displayed. You just need to type the line in filter tool bar. 


Logical Operators

You can just type the name of the operator in English or you can use the logical symbols like you do in programming to make a logical filter which will display the logical truth result of 2 or more conditions.


Using above commands, conditions & operators you can write complex statements like the following to filter packets in a capture.

Ex:- !(ip.flags == 0x40) && ip.addr==10.227.54.142

Additional Notes:-

If you want to filter packets by a protocol name, you just need to type the protocol name
Ex:- 'dns' will display all the DNS packets
Ex:- 'http' will display all the http packets

If you want to find TCP packets with ACK flag set, you should use 'tcp.flags.ack == 1
If you want the TCP packets with acknoledgement number equal to 1 'tcp.ack == 1'

Use 'frames.len > 1514' will display the jumbo frames.

Saturday, February 3, 2018

Let's analyze DHCP packets using Wireshark and see what's really going inside the wire..


You can see the DORA (Discover, Offer, Request, Acknowledgement) packets going through.

Discover

This packet is sent by the client as a broadcast with a source IP address of 0.0.0.0 and a destination IP address of 255.255.255.255
Source MAC address is the client's MAC address and the destination MAC address is FF:FF:FF:FF:FF:FF
Source Port is udp 68 (bootpc) & destination port is udp 67 (bootps)

Offer

This packet is sent by the server as a unicast with a source IP address of the DHCP server and the destination IP address of the client which the server is going to offer in the future.
Source MAC address is the DHCP server's MAC address and the destination MAC address is the client's MAC address
Source Port is udp 67 (bootps) & destination port is udp 68 (bootpc)

If you analyze further in Bootstrap information, it shows the IP address to be given which is equal to the destination IP address of the packet.


Request

This packet's source & destination IPs, MACs & port numbers are same as the Discover packet. But in the Bootstrap information it shows the requested IP. In this case it is same as the offered IP.


Acknowledgement

This packet's source & destination IPs, MACs & port numbers are same as the Offer packet which confirms the lease.

Note:- 

When the client is down and come up again within the lease time, the client sends only the Request and the DHCP server sends only the Ack.

Sunday, December 10, 2017

Cisco switches support a method of directing a copy of all traffic from a source port or source VLAN to a single port on a remote switch. This feature is called RSPAN..

In RSPAN you create a source that consists of at least one port or at least one VLAN on a switch. Destination for this session is the RSPAN VLAN. That special VLAN can be extended across a switched network to transport the directed copy of traffic to receive on a destination RSPAN port.

Let's see an example configuration..

Going to capture SW-3's e0/2 traffic and export to the destination port on SW-1's e0/3..

Note: Ethernet interfaces will be FastEthernet interfaces in configuration as I am doing this on a actual Cisco 2960 switch..

Configuration in SW-3

Creating RSPAN VLAN;
SW-3(config)#vlan 99
SW-3(config-vlan)#remote-span

Defining source port & destination RSPAN VLAN;
SW-3(config)#monitor session 3 source interface fa0/2
SW-3(config)#monitor session 3 destination remote vlan 99

Allowing RSPAN VLAN on Trunk;
SW-3(config)#int fa0/3
SW-3(config-if)#switchport trunk allowed vlan add 99

Configuration in SW-2

Creating VLAN;
SW-2(config)#vlan 99

Allowing RSPAN VLAN on Trunk;
SW-2(config)#int range fa0/2-3
SW-2(config-if-range)#switchport trunk allowed vlan add 99

Configuration in SW-1

Creating RSPAN VLAN;
SW-1(config)#vlan 99
SW-1(config-vlan)#remote-span 

Defining source port & destination RSPAN VLAN;
SW-1(config)#monitor session 1 source remote vlan 99
SW-1(config)#monitor session 1 destination interface fa0/3

Issuing show monitor session command on SW-3 & SW-1;


Now let's take a more complex example where a combination of VLANs and ports are to be monitored. SPAN restricts sourcing VLANs & ports to a same session in a same switch but the following is possible when the ports and VLANs to be monitored are in different switches.


In this example SW-3's e0/2 traffic and VLAN 3 traffic in SW-2 should be exported to the destination port on SW-1's e0/3..

You just need to make VLAN 99 on SW-2 to be a RSPAN VLAN instead of a normal VLAN and define the source VLAN..

Making VLAN 99 a RSPAN VLAN;
SW-2(config)#vlan 99
SW-2(config-vlan)#remote-span

Defining source VLAN & destination RSPAN VLAN;
SW-2(config)#monitor session 2 source vlan 3
SW-2(config)#monitor session 2 destination remote vlan 99

Issuing show monitor session command on SW-2;


Cisco switches support a method of directing a copy of all traffic from a source port or source VLAN to a single port. This feature is called SPAN or Session Monitoring..

In SPAN you create a SPAN source that consists of at least one port or at least one VLAN on a switch. On the same switch you configure a destination port. The SPAN source data is then gathered and delivered to the SPAN destination.

Let's see an example configuration..

Let's say PC1 & PC2 are active on a switch. A sniffer is connected to e0/3 and going to capture;
receiving traffic of e0/1 transmitting traffic of e0/2
& read them via a protocol analyzer like Wireshark..

Source Ports: e0/1 & e0/2
Destination port is e0/3..


Note: Ethernet interfaces will be FastEthernet interfaces in configuration as I am doing this on a actual Cisco 2960 switch.. 

SW(config)#monitor session 1 source interface Fa0/1 rx
SW(config)#monitor session 1 source interface Fa0/2 tx
SW(config)#monitor session 1 destination interface Fa0/3

Issuing show monitor session command;

You can bind many source ports but you cannot bind a source VLAN with source ports in the same monitor session..


Let's say we want to capture all traffic of  VLAN 1, removing previous commands and re-configuring..

SW(config)#monitor session 2 source vlan 1
SW(config)#monitor session 2 destination interface Fa0/3

Issuing show monitor session command;

Note that if I haven't removed the previous config, I cannot bind same destination port Fa0/3 to 2 monitor sessions..


Let's take another example which shows how to capture traffic of some VLANs on a trunk link.


In the trunk between SW-1 & SW-2  VLANs 1-5 are configured and not pruned..

If I just want to capture traffic on VLANs 1 & 3 from e0/2 interface (trunk)..

Removing all previous configuration,

SW-1(config)#monitor session 3 source interface Fa0/2
SW-1(config)#monitor session 3 filter vlan 1 , 3
SW-1(config)#monitor session 3 destination interface Fa0/3 encapsulation replicate

Last line encapsulation replicate command will allow copying and forwarding of CDP, BPDU, VTP, DTP, PAgP etc frames which are normally ignored by SPAN..

Issuing show monitor session command;


Wednesday, August 2, 2017

When you try to do a wireless packet capture for your protocol analysis / troubleshooting purposes using Wireshark on your Microsoft Windows laptop, you will notice that most important frames / packets (802.11 frames & EAP packets) are missed. So here is a free tool for Windows to do your wireless captures. It is called Microsoft Network Monitor. This is actually a Microsoft made protocol analysis tool like Wireshark. You can do a lot more with it..

Please go to the link below.. Or just search Microsoft Network Monitor on Microsoft.com

http://www.microsoft.com/en-us/download/details.aspx?id=4865

This is built for Windows 7, but it works in Windows 8 & 10 too.

Download your version to match the CPU architecture and install it.
Restart or Logoff your PC and Login again..
Run the App..

(click on the images to see in full size)


You can select the interface you need to capture. You can see that this is not only for wireless, but also for wired interfaces.

Then click on New Capture and Start..

Friday, November 13, 2015

It is possible to wiretap IP phones using Wireshark. If you have access to the network switch which the target phone is connected, you can capture packets of that interface and rebuild the conversation using Wireshark software easily.

Here, my target phone is connected to the Fa0/13 of a Cisco switch. And my PC is connected to the Fa0/9.

I need to start a monitoring session to mirror the port Fa0/13 as source and the destination port as Fa0/9 using following commands.

S(config)#monitor session 1 source interface Fa0/13
S(config#)monitor session 1 destination interface Fa0/9


Start a Wireshark capture from the PC & wait for a call. You can see RTP in protocol field when a call is taking place.  (click on the images to see in full size)


When the capturing is over save the capture and go to Telephony --> VoIP Calls


Click on a completed call and click on Player


Click Decode


You will see 2 streams for Rx side and Tx side. Tick a stream and hit Play

Note:- 

Currently supported protocols for VoIP in Wireshark are SIP, H323, ISUP, MGCP & UNISTM. Supported codes are G711 A-Law & G711 u-Law only.

Monday, September 28, 2015

I am using 3 routers with Cisco IOS 15.0 code for this demo. Note that IOS XE routers have a different approach than this. Also I use my laptop as TFTP Server which I use to export and view captured packets.

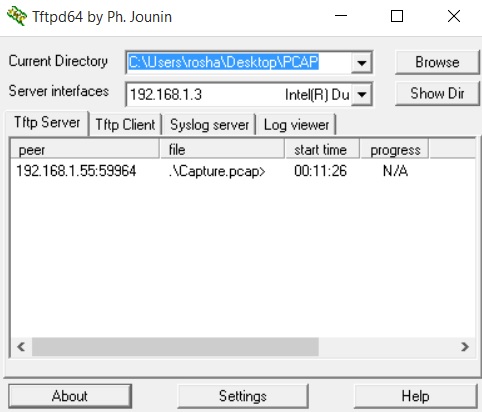
TFTP software used is TFTPD64 which is configured as the server interface to be the IP address of my laptop's network card.

Captured files will be exported into the folder named PCAP on the desktop.

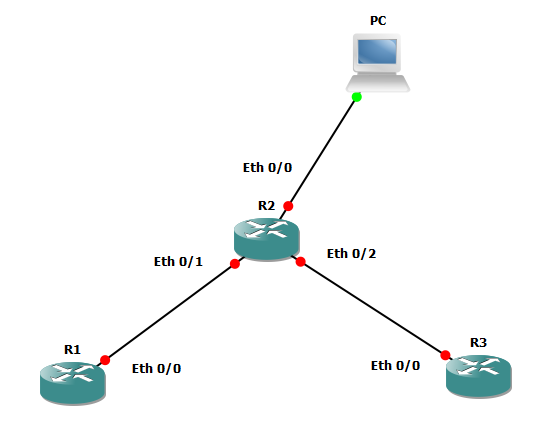
Setup is simple as shown in the diagram below.


IP address are;

R1 e0/0 : 1.1.1.1

R2 e0/0 : 192.168.1.55
e0/1: 1.1.1.2
e0/2: 1.1.2.2

R3 e0/0 : 1.1.2.1

PC: 192.168.1.3


Routers are running EIGRP

Steps:


1) Define Capture Buffer
2) Define Capture Point
3) Associate Capture Point with Capture Buffer
4) Start Capture & End Capture
5) Export to server

Configuration: 

Capturing both in/out traffic at E0/1 in R2

R2#monitor capture buffer PCAP
R2#monitor capture point ip cef CAP_POINT e0/1 both
R2#monitor capture point associate CAP_POINT PCAP
R2#monitor capture point start CAP_POINT


R1#ping 1.1.2.2

R2#monitor capture point stop CAP_POINT
R2#monitor capture buffer PCAP export tftp://192.168.1.3//Capture.pcap


There are more options to define buffer size etc in command line. Also you can specify Access Control Lists to capture the exact packets you want.

And also you can view captured packets in CLI too but it is more easy with Wireshark to analyze.


Now you can open it in Wireshark..

To see capture works before exporting you can use;

R2#show monitor capture buffer all parameters

and see the output which says the number of packets captured and the Active status of Capture Point